JobPack® has been specializing in digital solutions since 1992, so we understand the importance of connecting the right data with the right people to make informed decisions.
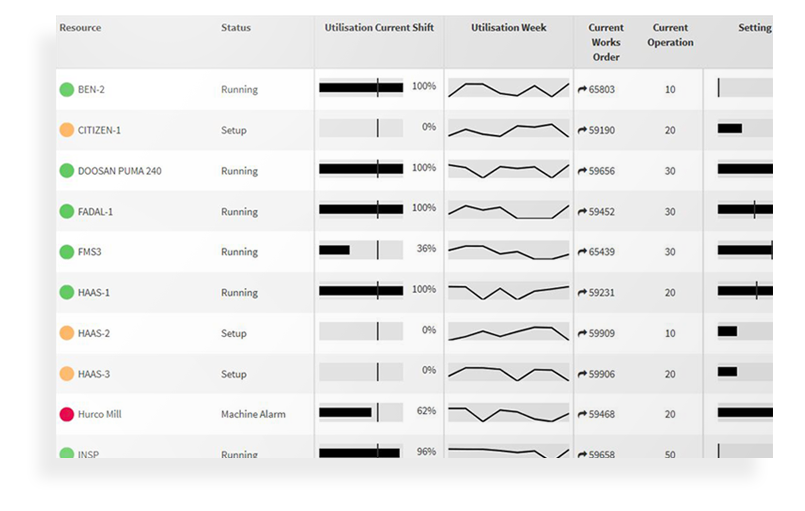
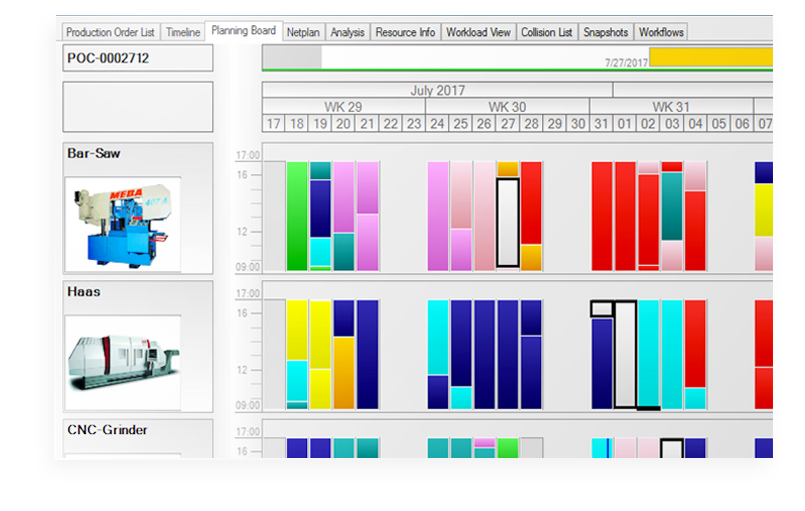
Visibility is key.
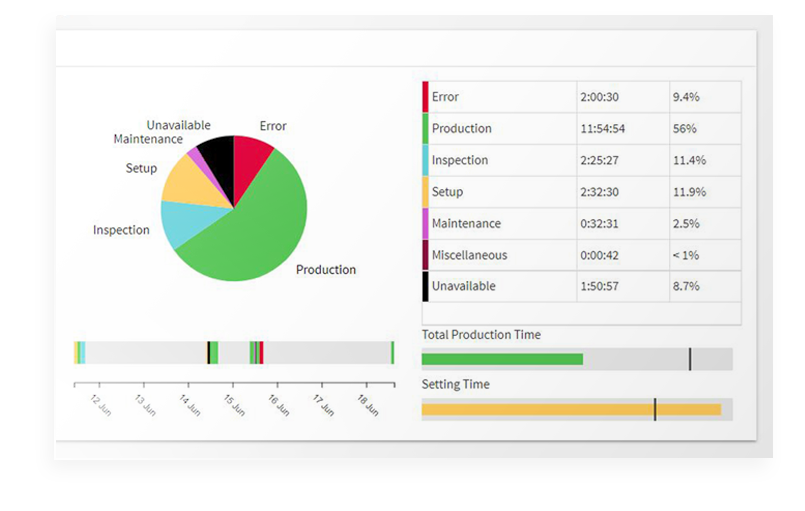
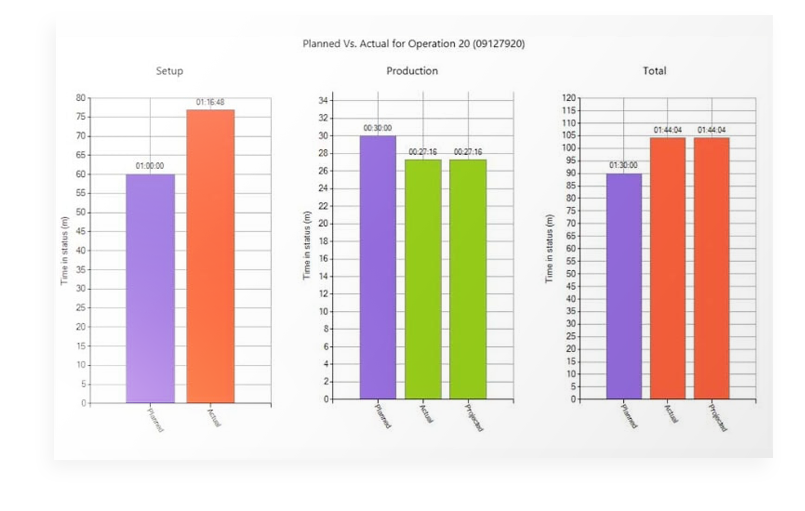
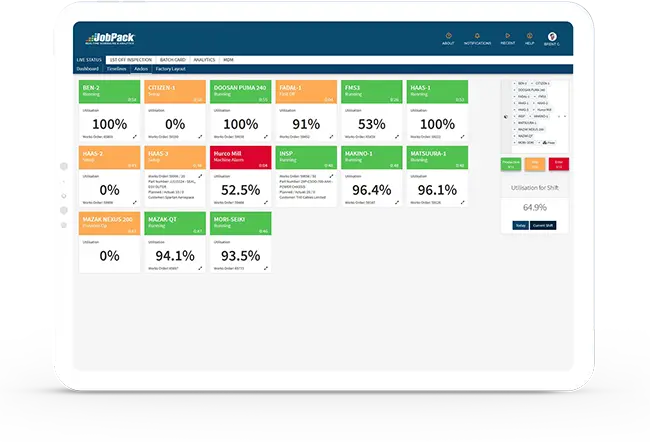
Monitor all the machines in your shop on one screen, in real time. Keep a close watch on usage, downtime reasons, and other factors that directly impact the efficiency of your shop floor, just by looking at your computer.