Data Analytics
Production Reporting System: Turning Shop Floor Data into Business Intelligence
Published July 17th, 2026
Paper production logs filled out at the end of a shift do not save money. By the time a manager reads that a CNC machine went offline at noon, the day is already lost. These delayed updates prevent real-time adjustments and choke shop floor throughput.
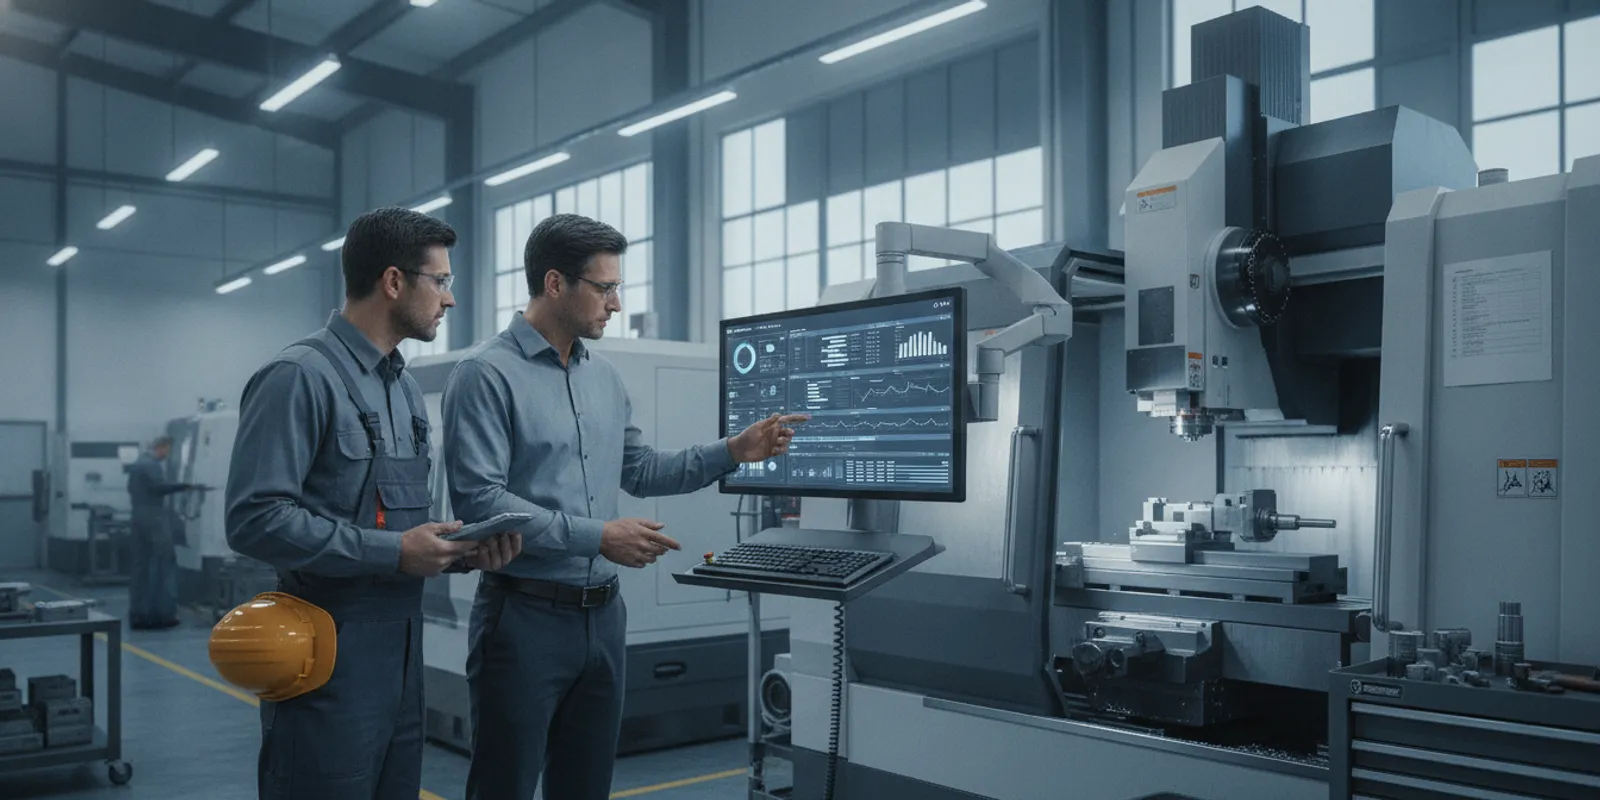
A production reporting system is a dedicated manufacturing execution system (MES) software solution that automatically captures, processes, and displays shop floor data in real time. Instead of relying on manual paper logs or end-of-shift spreadsheets, this system connects directly to your CNC machines. It tracks live progress, machine uptime, and parts completed automatically. Plant operators and scheduling managers use these automated reports to find floor bottlenecks quickly. They can calculate overall equipment effectiveness (OEE) and adjust production schedules on the fly. By turning raw physical machine outputs into visual dashboards, the system eliminates communication delays between the shop floor and management. This helps small-to-medium discrete manufacturers optimize machinery use, reduce expensive changeover times, and make faster business decisions.
Transitioning away from slow manual tracking requires a clear understanding of how these modern digital platforms organize your operational data. To help your business evaluate these tools, we must define their core features and daily workflows on the shop floor. The path begins with What Is a Production Reporting System?
What Is a Production Reporting System?
A production reporting system is a structured software tool used by discrete manufacturers to record, track, and analyze shop floor activities. In high-mix, low-volume environments, this system acts as the central nervous system for operations. It collects data on machine states, labor hours, completed parts, and material scrap. By capturing this data, the system helps plant managers make fast decisions, optimize labor, and reduce costly downtime.
Many shops still try to manage their lines with manual methods. But relying on handwritten logs or basic spreadsheets often leaves managers blind to real floor conditions. A modern system replaces guesswork with facts. By using dedicated manufacturing analytics software, shops can track actual output against their plans in real time. This keeps schedules accurate and prevents shipping delays.
From Paper Logs to Digital Databases
For decades, shop floor reporting relied on paper logs. At the end of a shift, machine operators would write down their run times, part counts, and scrap totals on paper sheets. These paper logs then sat on a desk until someone manually typed them into a spreadsheet. This old way of tracking creates long delays and leads to frequent entry errors. According to research on manufacturing systems, manual entry has error rates that make shift data unreliable for scheduling.
The move to digital databases changed how shops handle this data. Modern databases store every machine event and operator action as it happens. This change eliminates the delay of manual entry. It also ensures that managers work with clean, accurate data. Managers no longer have to wait for the next morning to see yesterday’s problems. Instead, they can view live metrics and address issues before they ruin a shift.
The Main Types of Production Reports
To keep a manufacturing plant running smoothly, leaders must track several key metrics. A robust reporting system organizes raw floor data into distinct, actionable reports. These reports help teams find bottlenecks and improve efficiency across the entire shop floor.
The most critical reports for discrete manufacturers include:
- Machine Utilization Reports: These show exactly how many hours your machines spend cutting metal versus sitting idle. They help find underused assets and highlight the root causes of downtime.
- Labor Efficiency Reports: These track the actual hours spent on a job against the estimated standard time. This helps planners schedule labor more accurately.
- Scrap and Rejects Reports: These record the volume of wasted material and the reason codes for part failures. This data helps quality teams fix issues fast.
- On-Time Delivery Reports: These measure how well the shop meets its customer ship dates. They help planners spot late jobs early.
Smarter Reporting with JobFacts
For mid-market manufacturers who have outgrown spreadsheets, JobPack offers a powerful solution. The JobFacts Data Analytics module is a specialized reporting tool built directly into the JobPack MES platform. It automates the entire data collection and reporting workflow. This means your team no longer has to spend hours compiling reports at the end of the day.
With JobFacts, your shop gets automated end-of-day, end-of-month, and year-end reporting capabilities. The system gathers data directly from your machines and operators. It then formats this data into clear, interactive charts. Planners can quickly run planned versus actual comparisons to verify job costs. By automating these tasks, JobFacts gives you the precise insights you need to boost shop floor performance.
Why Manual End-of-Shift Reports Are Failing Manufacturers
Many shop floors still run on historical data. Every day, production leaders across the shop floor start their morning the same way: open the Daily Production Report to see what happened yesterday. This classic approach is common, but relying on manual end-of-shift reporting is a risk. Mid-market discrete manufacturers often find they have outgrown manual systems, yet complex enterprise systems are too heavy. Relying on hand-written logs and retrofitted spreadsheets creates major blind spots that hurt daily output.
The Real Cost of Yesterday’s Production Data
When operators write down part counts and downtime reasons by hand, plant leaders only find out about problems hours after they happen. This delay makes it impossible to fix issues during the shift. By the time a supervisor reads the shift log, the lost time is gone, and the schedule is already behind. This delay forces teams to react to past mistakes instead of steering active jobs to success.
- Severe data latency from end-of-shift collection: Paper logs sit on the shop floor until a shift ends. Plant managers only see machine downtime or low cycle times hours after they occur. This delay turns active management into reactive post-mortem reviews, making it impossible to save a failing run.
- Common transcription errors: Moving handwritten notes from a paper log to an Excel spreadsheet leads to mistakes. Numbers get misread, typos slip in, and some details get lost. This human error means your core performance metrics do not reflect actual shop floor reality.
- Lack of drill-down capability: A static spreadsheet can show that a machine missed its goal, but it cannot tell you why. Leaders cannot click into the data to see if the cause was a raw material delay, a long changeover, or a tooling alarm. Without these details, resolving root causes is mostly guesswork.
- No real-time visibility into active problems: Manual reporting provides no live alerts when a CNC machine stops running. If a machine sits idle for an hour, managers do not know until they read the final report. This lack of live data hurts production efficiency reporting and lowers overall plant output.
- Reactive instead of proactive management: Supervisors spend their time auditing past logs instead of planning future runs. They are forced to solve yesterday’s bottlenecks rather than preventing today’s delays. This constant firefighting keeps operational costs high and limits capacity.
- Lost tribal knowledge and poor notes: Operators often write brief notes like “machine down” without adding context. Over time, the true reasons behind chronic failures are lost. Without clear, digital records, teams cannot track trends or share insights across different shifts.
Transitioning to Live Shop Floor Tracking
To fix these issues, modern plants must shift from manual forms to automated tools. Capturing machine data directly from CNC equipment removes human error and gives leaders facts they can use. Reliable studies from the National Institute of Standards and Technology show that automated data capture improves data accuracy and operational efficiency. By tracking machine states and part counts as they happen, plants can find and resolve bottlenecks before they ruin a shift.
Essential Production Reports Every Manufacturer Should Track
A modern production reporting system provides the clear data that shop floor leaders need to make smart choices. Without these reports, managers must guess why jobs are late or why scrap rates are high. Tracking the right metrics lets you spot bottlenecks before they delay a customer order.
The Core Elements of Plant Intelligence
Four main reports form the backbone of shop floor intelligence. These documents track machine run time, staff output, material waste, and delivery schedules. Together, they show a complete picture of your daily operations. They turn raw plant data into clear facts that help you cut costs and raise output.
By comparing these metrics, plants can find the root cause of lost time. For example, low machine use might stem from slow setups or from late raw materials. Having these facts in real time helps managers solve problems fast instead of waiting for the end of the shift.
Comparing Key Production Reports
| Report Type | What It Measures | Why It Matters | How Automation Improves It |
|---|---|---|---|
| Machine Utilization | Active run time versus total planned hours. | Shows if expensive assets are sitting idle. | Captures live CNC status to remove manual entry errors. |
| Labor Efficiency | Actual hours worked versus standard job hours. | Tracks staff output and highlights training gaps. | Syncs operator logs directly with active job cards. |
| Scrap/Quality Rate | Good parts made versus total parts produced. | Identifies tool wear and material defects early. | Logs part counts straight from machine controls. |
| On-Time Delivery | Percentage of orders shipped by the due date. | Directly impacts customer satisfaction and repeat sales. | Updates order status live to show potential delays. |
Unifying Metrics Through OEE
While each report is helpful on its own, the best plants combine them. Overall Equipment Effectiveness, or OEE, blends machine use, speed, and quality into one score. This single number tells you how well your shop floor is working. It helps you see the true capacity of your machines.
Using a live dashboard for production efficiency reporting gives you these metrics in real time. Instead of looking at old spreadsheets, managers can see live progress on their screens. JobPack connects directly to your CNC machines to make this process simple. This live connection keeps your scheduling tight, keeps your jobs on track, and boosts your bottom line.
How Real-Time Shop Floor Data Collection Transforms Production Reporting
A manual production reporting system relies on operators writing down times, part counts, and scrap reasons at the end of each shift. This delays key choices and leads to data errors. Modern shops use live shop-floor data collection to bridge the gap between the shop floor and scheduling systems. Here is how that process works.
Machine Data Capture
First, the system connects directly to factory equipment. It uses industry protocols like MTConnect, OPC UA, and Modbus. These systems plug into your Ethernet network to read raw CNC controller states without physical changes to the machine. You get clean, instant data directly from the source.
Operator Input and Activity Codes
Machine data does not show the full picture. If a spindle stops, the machine only knows it is idle. To capture human context, operators use a simple screen. They choose from 64 user-defined activity codes to tag downtime reasons like tool wear or material delays. This pairs automation with human detail.
Live Status Tracking
The system monitors machine states in real time. It marks each asset as running, idle, down, or off. Leaders can view this live status on a digital shop floor map. They see problems instantly rather than waiting for an end-of-shift report. This allows for fast, proactive troubleshooting.
OEE Calculation
With live data, the software calculates Overall Equipment Effectiveness (OEE) on the fly. It scores performance, availability, and quality as parts run. This instant score helps teams find slow cycle times and check if a job is on track. You can spot issues before they ruin a shift’s yield.
Live Dashboards
Finally, live dashboards replace paper logs and manual spreadsheets. Planners and managers view live metrics from any screen. They see true capacity, part counts, and bottleneck areas. This clean data flows directly into your scheduling software to keep dates accurate.
-
Machine data capture: The system links to your assets using MTConnect, OPC UA, or Modbus to read raw machine state data via Ethernet.
-
Operator input: Operators use shop floor screens to select from 64 user-defined activity codes, adding human context to machine downtime.
-
Live status tracking: Software tracks machine states as running, idle, or down, displaying live conditions on a digital shop floor map.
-
OEE calculation: The system computes OEE on the fly, scoring availability, performance, and quality as production runs.
-
Live dashboards: Live dashboards replace paper logs, serving clean metrics directly to your planners to keep schedules accurate.
By moving to automated shop floor data capture, you remove manual steps. This helps shop leaders find and resolve bottlenecks as they happen. Accurate, real-time data ensures your manufacturing business intelligence dashboard stays reliable.
Turning Raw Production Data into Business Intelligence with JobFacts
Operations managers often find themselves drowning in manual spreadsheets. They spend hours trying to piece together a clear picture of shop floor performance. JobPack resolves this data delay through its JobFacts Data Analytics module. This tool turns raw production numbers into visual, actionable insights.
Eliminate Spreadsheet Chaos
Traditional reporting depends on manual logs and late-night data entry. By the time a manager reads a shift report, the information is already cold. JobFacts replaces this lag with a single source of truth. The system gathers machine data to feed live, visual dashboards instantly.
Planners can view current performance instead of guessing what happened yesterday. This live view helps teams catch bottlenecks before they ruin a delivery schedule. Live facts help custom job shops protect their profit margins.
Integrate ERP for Full Reporting
Isolated data limits your ability to scale operations. Integration with client ERP systems for comprehensive reporting bridges the gap between shop floor actions and business planning. JobFacts connects machine status, jobs, and staffing details directly to your main system.
This central view links actual manufacturing costs with billing and scheduling. Teams can compare planned job costs with actual shop floor performance. This makes it easy to find where profits leak from production lines.
Drill Down with Root Cause Tools
Knowing that production is slow is not enough. You must know why. JobFacts features interactive charts with drill-down capabilities. Users can click on any drop in efficiency to view downtime reasons.
Built-in root cause analysis tools let teams sort downtime by specific categories. You can see if a machine stopped because of material delays, tooling issues, or labor shortages. This detailed data guides plant managers. It helps them improve overall equipment effectiveness.
Track Long-Term Trends and Export Reports
To grow, shops must look beyond the current shift. JobFacts supports historical performance tracking and forecasting. Planners can spot seasonal trends, track tool wear, and forecast labor needs based on past production data.
Sharing these insights across your company is fast and simple. The system offers flexible export capabilities for .csv, .xlsx, .dat, .doc, HTML, and PDF formats. This ensures that every stakeholder has the right data format when they make plans.
Discrete manufacturers can get these insights working in their facility quickly. JobPack features a 6-week implementation timeline. This is much faster than the typical 6-to-12-month schedule of complex, enterprise-level systems. You can start building your manufacturing business intelligence without long setup delays.
How to Select the Right Production Reporting System for Your Shop
Choosing a new production reporting system is a major step for mid-market discrete manufacturers. Your team needs a tool that fits your unique shop floor layout and work patterns. High-mix, low-volume shops have different needs than high-volume assembly lines. Because of this, you must evaluate tools based on how well they handle frequent changeovers, shared resources, and complex schedules.
If you have between 20 and 200 employees, 5 to 50 CNC machines, and $5M to $50M in revenue, you are in the sweet spot for specialized systems. Large, complex enterprise platforms often require months of costly setup. To find the right balance, look for a modular system that connects directly to your machines and integrates with your current tools. To see how our platform fits these specific needs, you can learn more about JobPack and our fast 6-week setup timeline.
Key Criteria for Your Shop Floor
When you evaluate systems, compare options across several key areas. The goal is to move from manual, late reports to real-time shop floor insights without slowing down your operators or planners.
| Evaluation Criteria | Why It Matters | What to Look For |
|---|---|---|
| Data Collection Method | Manual logs cause data delays and typing errors. | Automated machine connections with simple operator code inputs. |
| ERP Integration | Disconnected tools force team members to type the same data twice. | Two-way data sharing that syncs job details and schedules. |
| Setup Timeline | Long setups drain your team and delay your return on investment. | A simple, proven plan that gets your shop live in weeks, not months. |
| Platform Scalability | You do not want to pay for heavy software modules you do not use. | Modular designs where you can add scheduling or monitoring as you grow. |
| Reporting Depth | Basic charts do not show the real root causes of machine downtime. | Built-in OEE dashboards with deep drill-down tools. |
Matching System Capabilities to Shop Size
Smaller shops cannot afford to lose days of work to complex training. That is why ease of use and simple screens are just as vital as technical features. A useful system should help your team make faster, better shop floor choices on day one.
Your team needs clear facts to keep jobs on track. Look for a partner that has deep experience in discrete manufacturing sectors like aerospace, medical devices, and custom job shops. These sectors require precise tracking, clear records, and live status reports to meet strict customer standards. To verify this, check if your provider has a solid history of helping shops of similar size and complexity.
Frequently Asked Questions
Why should manufacturers transition from manual end-of-shift reports?
Manual reports lead to data delays and human errors. When operators write down machine runtimes or part counts at the end of a shift, managers only find out about bottlenecks hours after they happen. Moving to an automated MES prevents these delays and provides accurate shop floor numbers when they occur.
How does real-time shop floor data collection improve production reporting?
Automated collection uses direct machine connections to track status, speeds, and downtime instantly. This removes the need for manual paperwork. Planners get immediate alerts for machine alarms, allowing them to adjust schedules and keep jobs moving. You can track this live data on our machine monitoring page.
How long does it take to implement an automated production reporting system?
While large enterprise software takes six to twelve months to set up, mid-market systems implement much faster. According to customer research, JobPack delivers a complete setup in about six weeks. This fast deployment lets manufacturers start tracking machine utilization and labor efficiency without months of production downtime.
Ready to Improve Your Shop Floor Visibility?
Relying on manual, end-of-shift reports means you are always reacting to yesterday’s problems. Every hour of delayed data leads to lost machine capacity, missed bottleneck alerts, and late shipments that hurt your customer relationships. By connecting your machines directly to a real-time system, you can see issues instantly and make informed decisions before your schedule falls behind.
Ready to streamline your reporting? Call 847-741-1861 to schedule a free demo and see how our data analytics module can help you.