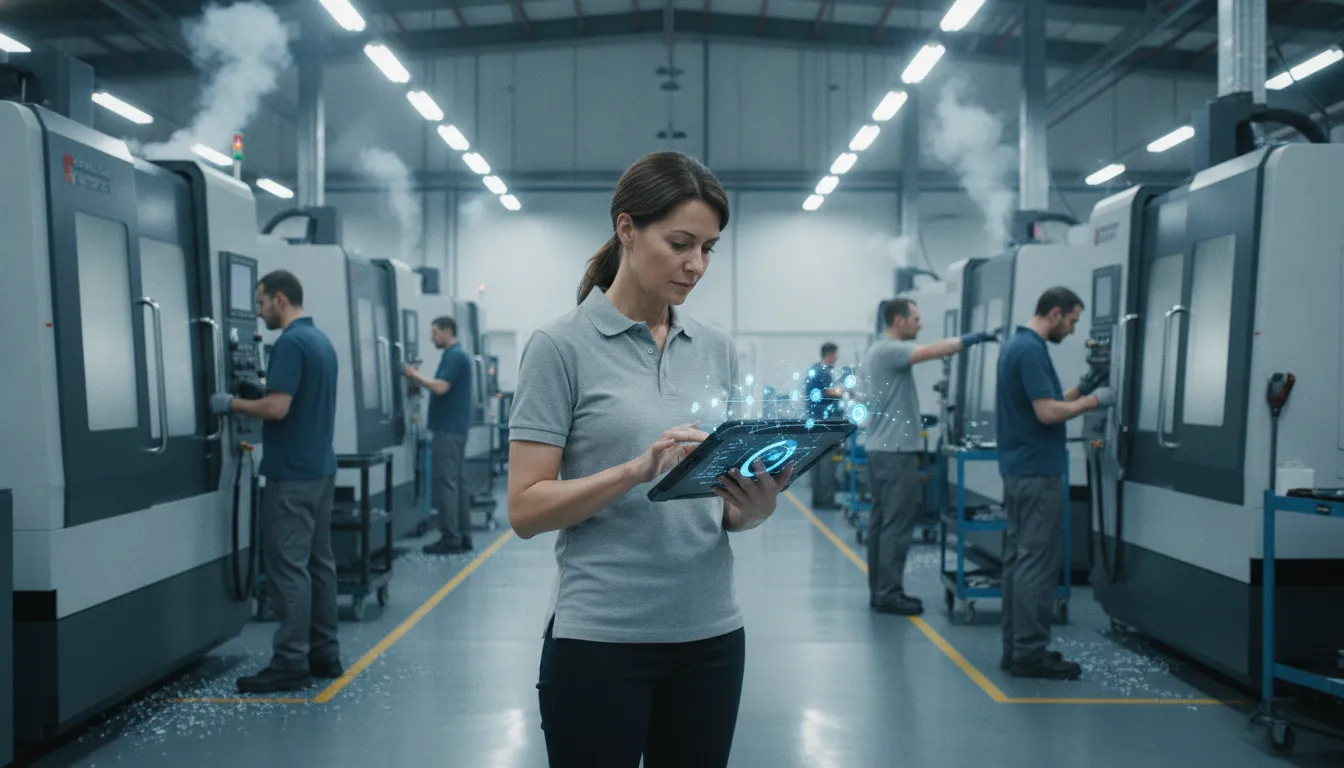
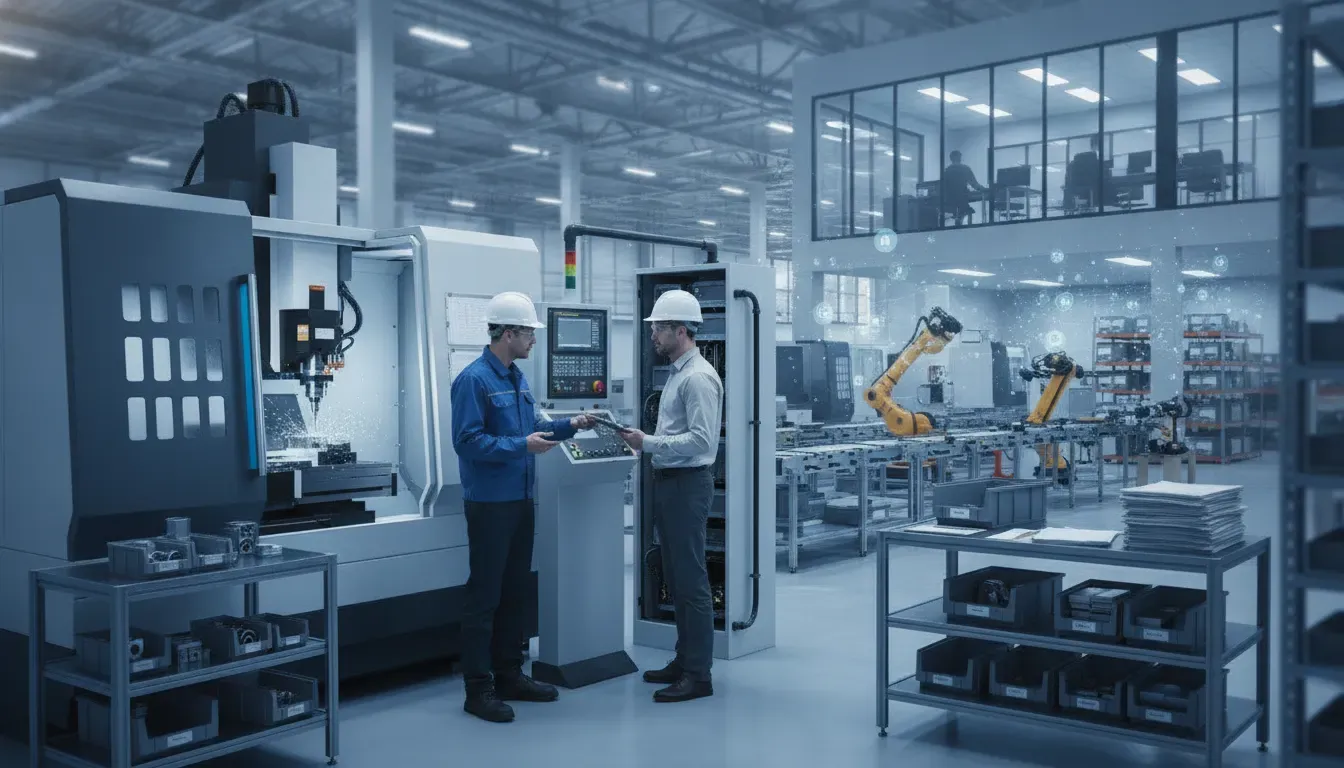
An empty CNC spindle on a busy Tuesday afternoon signals a costly breakdown in production visibility. When operators spend hours writing down machine status on paper logs, the raw data grows stale before managers can read it. Real-time visual tracking solves this.
Manufacturing dashboard software is a visual tool that connects directly to shop floor equipment to collect and display live production data. According to the National Institute of Standards and Technology, combining machine data and production output simplifies performance tracking and boosts floor productivity. By replacing paper logs with automated dashboards, managers can monitor key metrics like overall equipment effectiveness (OEE), machine status, and schedule adherence as they happen. This instant visibility removes the data latency that makes old reports useless, allowing supervisors to spot bottlenecks, reduce machine downtime, and make fast decisions. Ultimately, this software helps discrete manufacturers optimize workflows, improve delivery times, and lower production costs without the complexity of massive enterprise systems.
But how do these digital tools work on a busy shop floor, and how can they fit into your existing operations? To find the true value of live tracking, we must first answer What Is Manufacturing Dashboard Software? Here is how.
Request a demo of manufacturing dashboard software
What Is Manufacturing Dashboard Software?
Manufacturing dashboard software is a digital tool that shows live shop floor data on simple screens. It connects directly to your machines and scheduling systems. This software turns complex data into clear, visual signals. Managers can use these live views to see which jobs are on time and which ones are late.
A common mistake is to think that any screen with a chart is a dashboard. But basic screens only show old facts and do not update when things change. Dedicated dashboard software connects to live machine feeds to update schedules. This keeps your shop floor plans accurate as work happens.
How live software solves data latency
Modern shop floors create massive amounts of raw data every day. But this data is often hard to reach because it is trapped in different systems. Accessing it requires slow transformations that create lag for managers. This latency makes the data useless for quick choices on the factory floor.
According to an MIT research paper, raw data often stays stored in separate databases. This makes it hard to see how your entire plant is running. But software solves this lag. By pulling all raw data into one view, leaders can spot delays and make choices based on facts.
Centralizing data for information sharing
Good software pulls all production facts into a single place. A NIST blog post shows that putting machine data and output on one screen simplifies information sharing. This view helps teams find bottlenecks fast. When everyone sees the same numbers, your shop floor runs much better.
This real-time connection is a key part of any modern MES. With it, schedulers can adjust job queues instantly as machine statuses shift. You see issues right when they happen. This rapid feedback helps prevent scheduling errors and keeps jobs moving on time.
Key examples of visual shop floor tools
By using a unified tool, you see how each machine performs. To set up these views, you can review manufacturing KPI dashboard examples. These templates help you track OEE. This simple change removes the need for slow paper logs and long morning meetings.
Using live software can boost shop floor productivity by 15 percent or more. Managers see when a machine goes down. They can then assign a new job right away instead of waiting for hours. This keep-busy flow keeps your plant running smoothly even during busy weeks.
The Core Metrics a Manufacturing Dashboard Tracks
To run a lean plant, you need real-time data instead of old reports. Modern systems track live floor metrics to help you spot bottlenecks fast. These visual tools show your live floor status.
Using visual screens on a shop floor helps managers make better choices. This data-driven approach cuts down on guesswork for daily floor choices, as shown in research from MIT. By tracking live metrics, teams can find and fix floor problems fast.
Modern dashboard tools display a few vital metrics to keep your lines on track. Watching these areas helps you run your shop floor with ease. Here are the core metrics that floor teams should track:
- OEE: This tracks machine availability, speed performance, and product quality in a single score.
- Downtime tracking: This records when and why machines stop to help you cut bottlenecks.
- Throughput trends: This measures the volume of goods made over time to spot performance drops.
- Schedule adherence: This compares actual production times against your planned schedule to ensure on-time delivery.
Overall equipment effectiveness
The main metric for any shop floor is overall equipment effectiveness, or OEE. This core measure looks at three main areas to tell you how well your machines run. You can find out more about this metric by reading our full OEE calculation guide.
To get the most out of your plant assets, you need to track more than just raw speed. Your software must collect data on machine availability, performance, and part quality. This complete view lets you see which lines are meeting targets and which need help.
Downtime and shop floor productivity
When machines stop, your entire schedule slips. Tracking downtime events helps you find the root causes of production stops. Choosing the right manufacturing dashboard software helps you see these metrics with ease. You can see some visual layouts in our manufacturing KPI dashboard examples to help plan your own setup.
A good dashboard displays downtime by type so you know why runs halted. You might find that tool setup times, maintenance issues, or material shortages cause the biggest delays. This live insight helps your team fix problems before a delay ruins your shift.
Throughput trends and schedule adherence
Throughput tracks how many parts your plant makes over a set time. Adherence measures how actual production matches your planned schedule. Keeping these two metrics in sync ensures you meet ship dates and keep costs low.
Your MES plays a vital role in linking these shop floor metrics to your business systems. When scheduling software uses live throughput data, plan times adjust on the fly. This keeps your shop floor running at peak rates.
Operator Dashboards vs. Manager Dashboards
Good manufacturing dashboard software must serve different roles on the shop floor. Operators and managers need different views of live production data. While an operator looks at a single machine, a manager tracks the whole plant. The right view helps each person make the best decisions quickly.
To keep the shop floor moving, both roles need data that fits their daily tasks. Operators need real-time facts on their screens to run machines well. Managers need broader trends to plan shifts. When both views work together, the factory floor runs with less waste.
The operator view: live machine status and queue management
At the machine level, operators need a dashboard that updates by the second. They use these screens to check active job cycle times and live part counts. This view shows them the current job list so they can prep raw materials for the next run without waiting.
Operators also use these screens to log downtime reasons and read setup sheets. These live updates reduce the need for paper sheets and slow manual logs. Research shows that visual performance indicators on the floor reduce reliance on intuition for daily decisions. This helps operators stay on track without constant help from a boss.
When an operator logs a downtime event, the change shows up on the screen right away. This rapid feedback loop keeps the operator focused on output. This active logging ensures that the plant schedule stays accurate. As a result, operators can manage their own work pace with confidence.
The manager view: high-level trends and resource allocation
Managers do not need second-by-second updates from a single machine on the floor. Instead, they focus on overall plant health, labor capacity, and job flow. By visualizing real-time production data, managers can spot bottlenecks before they halt the line. This helps them use the MES to fix issues across departments.
Manager views on the dashboard typically refresh every hour or shift. They use these tools to check schedule adherence and track key metrics. They also review manufacturing KPI dashboard examples to see how to best shift labor. This high-level view helps managers make smart business decisions to improve output.
With these visual trends, managers can plan maintenance during scheduled downtime. They can also see which jobs are running late and adjust the plant schedule. This active scheduling planning prevents late deliveries and keeps customers happy. The dashboard software turns raw floor data into clear, useful facts for everyone.
| Comparison Criterion. | Operator Dashboard. | Manager Dashboard. |
|---|---|---|
| Refresh cadence. | Real-time, second-by-second updates. | Hourly, daily, or shift updates. |
| Key metrics. | Live machine status, part counts, cycle times. | Overall OEE, schedule adherence, scrap rates. |
| Main decisions. | Sequence tasks, log down reasons, prep tools. | Shift labor, change schedule, plan maintenance. |
| Level of detail. | High detail for individual machines. | Aggregated views for lines or plants. |
How Manufacturing Dashboards Bridge the Gap Between Shop Floor and Business Systems
Modern plants make vast amounts of raw data. Every machine and sensor sends a constant stream of signals. Yet, much of this rich data is either lost at once or stored raw in separate silos.
Disconnected data fails daily floor leaders. When machine status details stay locked in separate tools, supervisors cannot see the big picture. They must walk the floor to find issues. This manual process causes major delays and makes scheduling a constant guessing game. Planners often end up reacting to yesterday’s problems instead of today’s needs.
The manufacturing data gap
Using manufacturing dashboard software bridges this gap. The software connects directly to your shop equipment to capture live metrics. It turns raw, noisy machine signals into clean visual cues. Planners can see which jobs are on time and which are falling behind. This real-time view helps teams solve issues fast.
This link is key because it unites all systems. It connects the real shop floor with the scheduling tools of your MES. Instead of slow sheets, managers see live progress. This link ensures that plans reflect true shop floor limits.
Linking systems with real-time machine monitoring is the first step. This tool tracks whether machines are running, idle, or down. By automating this tracking, shops remove the need for manual logs. Operators can focus on running parts instead of writing down times.
Turning raw numbers into business results
Turning raw data into clear facts helps managers act quickly. Insights across all teams improve business choices by showing live trends across the entire plant. This direct view cuts out guesswork. Managers can adjust workloads before bottlenecks cause late orders or missed dates.
Setting up this plan relies on manufacturing data analytics to study history. When you compare past machine data with current output, you find key trends. These metrics help planners refine lead times. They can assign the right jobs to the best machines.
This setup eliminates the lag of end-of-shift reports. Instead of finding out about a failure hours after it happened, supervisors can react in minutes. When a machine stops, the dashboard alerts the team. This speed helps keep jobs on track and protects delivery dates. It keeps the shop floor moving forward.
Optimizing shop floor throughput
Using visual dashboard tools connects these layers as one. Studies show that using these tools can result in a 50% increase in throughput for targeted tasks. This setup helps daily decision-makers run lines. It cuts process time changes and keeps production running well.
Choosing Manufacturing Dashboard Software for Discrete Manufacturing
Connect to Your Factory Floor Machines
Your shop floor is complex. It runs many types of machines. To track production, your manufacturing dashboard software must connect right to your machines. You need a system that supports common standards like MTConnect and OPC UA to collect real-time data with ease.
When you connect your equipment, you remove the need for manual data entry. This live connection lets you track machine status, spindle run time, and active alarms. You can then feed this floor data right into your production scheduling system to make smarter planning choices.
Fit for High-Mix, Low-Volume Workloads
Discrete manufacturers often face high-mix, low-volume runs. In this environment, you cannot rely on simple guesswork. Real-time visual indicators on dashboards reduce reliance on intuition for daily decision-makers on the factory floor.
The same MIT study shows that setting up these visual tools can lead to big gains. Indeed, manufacturers saw a 50% throughput increase and a 70% reduction in throughput variation. This change also saved over 600 hours of labor cost per radar on target assembly lines.
Assess Cost, Setup Speed, and Scale
When you choose a tool, you must think about how fast you can set it up. Mid-market makers need to move quickly. A good system must fit your current budget while letting you grow. The right software should scale as you add more lines and machines.
Many tools take months to deploy. You should choose a system that can start showing value in days. High setup costs can drain your resources before you see any return. Quick setup lets your team learn the tool fast, which builds confidence on the shop floor.
Here are key things to look for in your software:
- Machine connection: The tool should connect straight to your machines with MTConnect.
- Workload fit: It must support make-to-order and high-mix, low-volume schedules.
- Setup speed: Look for systems that you can set up in weeks rather than months.
- Total cost: Avoid hidden fees for extra users or software updates.
- Data growth: The platform should scale as your shop expands.
A modern MES can help you compile this data to find bottlenecks. By using manufacturing data analytics, you can find the root cause of late jobs. This helps you make steady changes that improve your bottom line and boost shop floor output.
Implementing Manufacturing Dashboards: A Step-by-Step Approach
Preparing your shop floor
To get the most out of your shop floor, you must prepare your team for change. A study from the MIT DSpace repository shows that real-time charts help teams reduce their need for guesswork on the shop floor. A solid plan ensures a smooth rollout.
Before you buy any software, you must know what you want to fix. If your shop faces long setups or poor machine use, list those pains first. Listing these facts helps you set a clear starting point.
Next, check your current data sources. Many discrete shops use a mix of paper logs, spreadsheets, and basic software. You do not need to replace everything at once to start seeing value from your data. Focus on linking your key machines first to start strong.
Your implementation roadmap
- Inventory data sources. Locate and list all of your active shop data streams. This includes your ERP databases, machine sensors, and spreadsheets. Finding these sources first ensures you do not miss key facts.
- Define the KPIs that matter. Choose the vital stats that guide daily tasks on your shop floor. Focus on downtime, part counts, and OEE to keep goals clear. Do not track too many metrics at once.
- Select the tool and integrations. Choose a reliable manufacturing dashboard software that connects with your shop tools. Make sure it links with your MES to sync plans with live floor data. Simple setups are key to success.
- Pilot on one production line. Test the new tool on a single work cell first. This helps you find and fix bugs before a full rollout. It also lets your team get used to the new screens.
- Roll out role-based views. Give operators and managers custom screens that fit their daily tasks. Operators need status updates, while managers track high-level trends. Custom views keep everyone focused on what they can control.
- Review and iterate. Gather feedback from your team every week to improve your screen views. Keep updating your layouts to match new shop needs. Small changes make the system work well over time.
How dashboards improve production scheduling
Live dashboards work best when they connect to your planning systems. When you link your data with your production scheduling tool, you can spot bottlenecks as they happen. This means you do not have to wait for end-of-day reports to make crucial decisions.
Linking your shop tools with an active MES keeps your whole team on the same page. Operators can see their daily tasks on a clear screen, while managers can adjust plans on the fly. This real-time loop reduces waste, boosts throughput, and keeps your delivery dates on time.
When operators can view live job progress, they make fewer mistakes. Schedulers can instantly see if a machine goes down and move jobs to other open centers. This quick action keeps your shop running at top speed and prevents costly job delays.
Request a demo of manufacturing dashboard software
Frequently Asked Questions
Can manufacturing dashboard software connect to legacy shop floor machines?
Yes, modern manufacturing dashboard software connects to both new and older machines. It uses standard protocols like MTConnect, OPC UA, and Modbus to pull real-time data straight from CNC machines and PLCs. This connection automatically tracks machine status and removes manual data entry to show live shop floor visibility.
How does real-time data improve shop floor decision-making?
Real-time visual data on a dashboard reduces the need for guesswork. According to research from MIT, using these visual tools helps plant managers make fast decisions based on real data rather than gut feelings. Instead of waiting for paper reports at the end of the shift, teams see issues right away. This lets them solve bottlenecks before they cause costly delays.
What is the difference between a manufacturing dashboard and an MES?
A manufacturing dashboard is a single visual tool that shows key metrics like machine status. In contrast, an MES is a full software suite that manages and controls shop floor work. A dashboard is often a core feature of a broader MES, helping teams track OEE. Our OEE calculation guide explains how these systems work together to boost daily output.
What results can a business expect from manufacturing dashboard software?
Using manufacturing dashboard software can lead to major gains in daily shop floor output. Research published by MIT shows that visual tools can boost throughput by 50 percent while cutting process swings by 70 percent. These dashboards also save hundreds of labor hours. Over time, these metrics help teams find and fix hidden bottlenecks to keep production on track.
Ready to visualize your real-time production data?
Manual tracking leaves your shop floor in the dark. Delayed numbers mean you cannot spot bottlenecks until they hurt your shipping dates. If you wait to fix these data gaps, you will continue to lose valuable time and money to unscheduled downtime every single day.
Connecting your machines now gives you a live view of your shop setup. When you link your systems, your planners can react to changes as they happen. This quick change helps you keep your delivery promises to customers and boost your daily throughput.
You can stop guessing about OEE metrics and start making smart choices based on real production data today. Accurate dashboards show you exactly where to focus to improve flow and cut waste on every job.
Ready to take control? Request a demo of manufacturing dashboard software